On the first day of every month, we send monthly forecast graphs of more than 32 major global assets to our subscribers so that they know in advance how an asset is expected to trend in the coming month. Throughout the month, combining the trend forecast and price forecast, we send trading strategies to our subscribers. In case you are only interested in forecast graphs, you can choose any of the following markets, and we will send you a monthly forecast graph of your chosen market. You can select any market, and you can order forecasts up to December 31st of the current calendar year. A sample of monthly forecast graphs is below. One is a trend top-bottom forecast graph (projection line painted in red and blue color), and another is a day-wise trend forecast graph (arrow graphs painted in green and red color).
- METALS: Gold, Silver, Copper,
- ENERGY: Crude Oil, Natural Gas.
- SOFT COMMODITIES: Coffee, Cotton, Sugar,
- GRAINS: Corn, Wheat, Soybean,
- STOCK INDICES: Nifty, Bank Nifty, Nifty 500, S&P, Dow, Nasdaq. Wilshire, Nikkei
- CURRENCIES: US Dollar Index, EUROUSD, GBPUSD, USDJPY, USDINR.
- TREASURY BOND: US 10 years yield. India 10yr Yield
- CRYPTO CURRENCY : Bitcoin,
- VIX : S&P VIX & India VIX
- STOCKS: NSE Stocks & NYSE Stocks
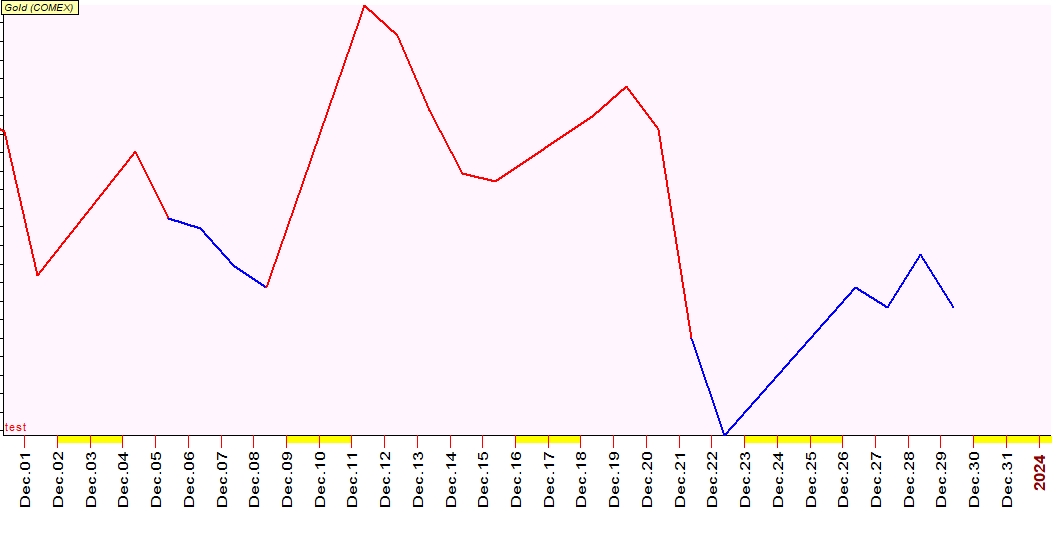
Gold Trend-Top-Bottom Forecast Graph December,2023
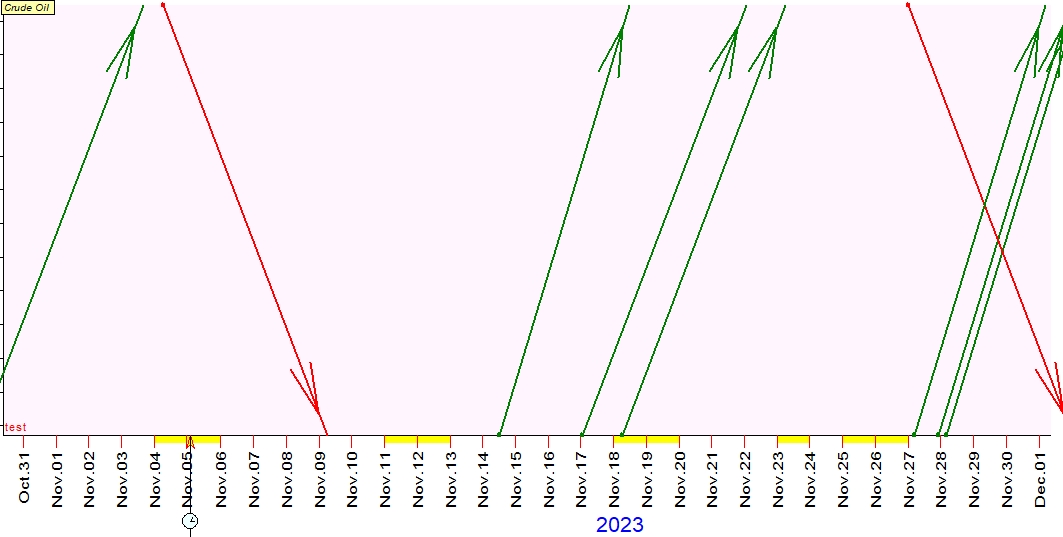
Crude Oil Day-wise trend forecast arrow graph for November, 2023
SUBSCRIPTION FEE
Any 1 market / 1 month period / Any 1 graph $105