Research
Gold Year 2030 Forecast
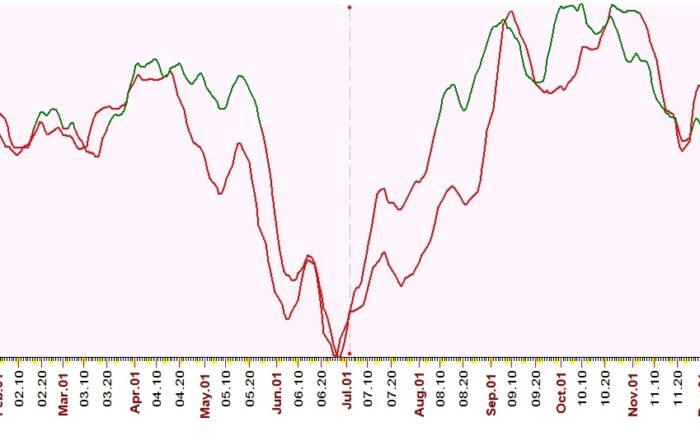
In this Free Research section, I am sharing the Gold 2030 day-wise trend, top and bottom forecast graph as part of my ongoing Price-Time Research. This graph shows the time side of the research. It
April 2026 is buy opportunity in Gold
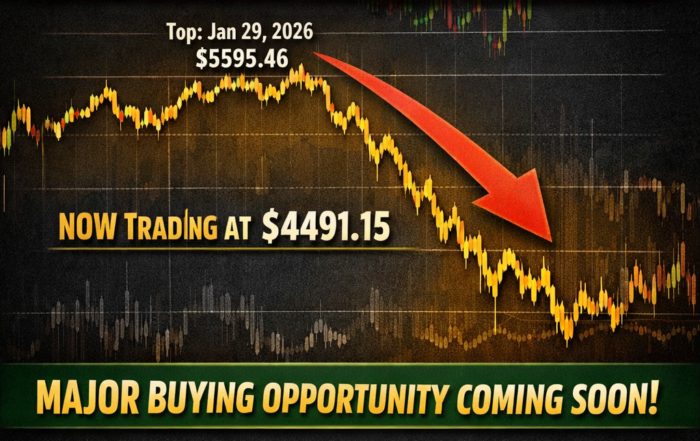
We Nailed the Exact Top in Gold Our forecast called for Gold Spot (XAUUSD) to top on 29 January 2026 (+/- 1 day) at 5592.22.In reality, gold made its all-time high exactly on 29 January
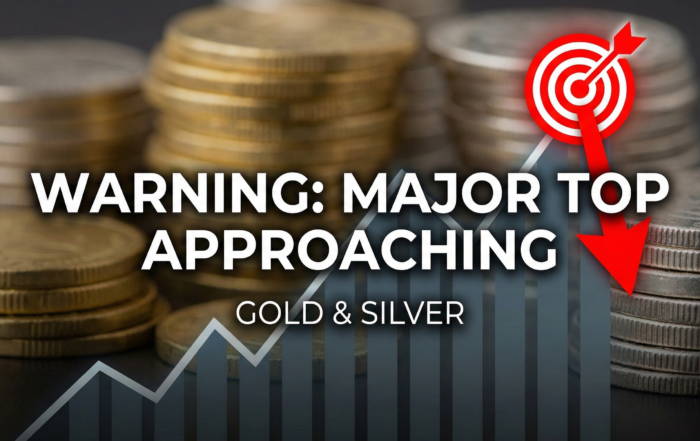
🎯 PREDICTION CONFIRMED: Gold & Silver Hit New All-Time Highs
On December 18th, we released free research on this website predicting the start of a new bull rally in precious metals. Today, the markets have validated that call: Both Gold and Silver are trading at
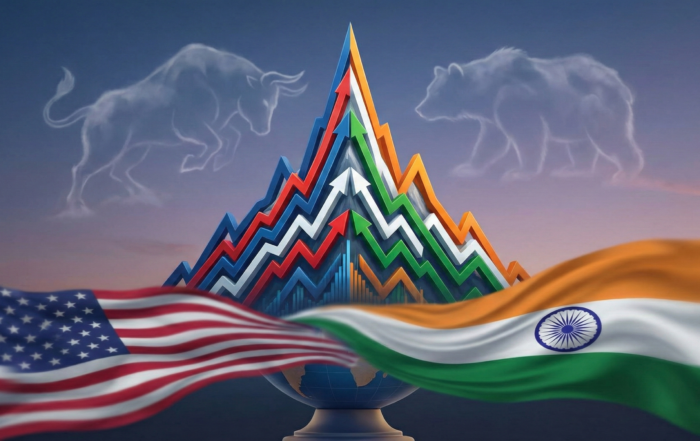
Important Top Is Coming Up in Indian and U.S. equity
An important top is coming up in Indian and U.S. equity markets. (For insights into the exact price levels and precise timing where we expect this top to form, please refer to our Subscribers’ Page.)
Can Market Tops & Bottoms Be Predicted Months Before They Happen?
Welcome to a World Where Markets Are Not Random – They Are Mathematical.
If you’re visiting this site for the first time, a natural question might arise: \”Can the market really be predicted?\”
The answer lies not in debate, but in experience: try it, live it, and witness it. Only through direct exposure can belief take root.
To truly appreciate the power of financial Celestial analytics, market cycles, and geometric stock patterns, one must see them in action—in the live market, in real time. That’s when the realization dawns: every price movement is not chaotic, but choreographed.
Whether it’s a stock, a commodity, or a cryptocurrency—each follows an invisible yet precise mathematical rhythm.
And once you start applying these time-tested tools, you’ll soon discover what we’ve always known: the market is pure mathematics in motion.
Our ancient scriptures have long stated that the entire universe is a point of force governed by mathematical laws—and the financial markets are no exception.
So, which mathematical tool is best for prediction? Gann? Geometry? Celestial analytics ? Cycles?
The truth is, all of them work—when used correctly.
Apply them with discipline and precision, and you can foresee:
- Market crashes
- Major tops and bottoms in gold and silver
- Annual highs and lows in indices like the Dow Jones
- Even long-term turning points in assets like crude oil and bitcoin
For over two decades, this has been my daily passion. It brings not just thrill and reward, but also deep soul-level fulfillment.
We don’t promise perfection—we promise precision with responsibility.
We don’t spin stories—we deliver clear, actionable forecasts with tight stop-loss strategies, because protecting your capital is our moral duty.
Welcome to a different way of seeing the markets.
One grounded in truth, tested by time, and driven by mathematics.
Best wishes,

How it Works ?
Once you subscribe through our Subscription Plans, your mobile number is added to our exclusive WhatsApp broadcast list.
We do not use email, newsletters, or login-based dashboards. Everything you need — from forecasts to trading updates — comes directly and privately via WhatsApp.
All past forecasts remain available on WhatsApp, so you can track our accuracy month after month.
⚠️Refund & Cancellation Policy
We are committed to delivering exceptional value. If, during your active subscription, you feel that our research or services are not useful, you may request a refund at any time. Simply email us with your request, and we will process a refund for the full unexpired portion of your subscription tenure. No explanations are required.
📆 What You Receive on the 1st of Every Month
On the first day of each month, we send you trend-top-bottom forecast graphs (day-wise) for the entire month in advance. These graphs cover 32+ major global assets including:
📈 Stock Market Indices:
USA: S&P 500, Nasdaq, Dow Jones, Wilshire 5000, QQQ
India: Nifty 50, Bank Nifty, Nifty 500, Sensex
Japan: Nikkei
💰 Commodities:
Precious Metals: Gold, Silver
Base Metals: Copper
Energy: Crude Oil, Natural Gas
Soft Commodities: Coffee, Cotton
Grains: Soybean, Corn, Sugar, Wheat
💱 Currencies & Volatility:
Major FX Pairs: USD Index, EURUSD, GBPUSD, USDJPY, USDINR
Volatility Indexes: S&P VIX, India VIX
📊 Bonds, Yields & Crypto:
Yields: US 10-Year Bond Yield, India Bond Yield
Crypto: Bitcoin
📈 Global Stocks:
Amazon, Microsoft, Alphabet
Tesla, Nvidia, Meta
HDFC Bank, ICICI Bank, Reliance Industries, Infosys
Each forecast includes exact trend, top, and bottom projections — day by day, for the full month. These forecasts are full and final — we never revise or change them mid-month.
🔍 When time and price come together, these graphs perform with a precision that feels close to prophecy.
We never promise 100% accuracy — only God can. But we’ve been right more often than wrong — for over 20 years.
📊 What You Receive During the Month (1st to 31st)
Throughout the month, based on the forecast graphs, we actively share:
- Real-time price forecasts
- High-probability trading opportunities
- Clear entry, target, stop-loss, and direction
You’ll always know where the market is headed — and how to act on it.
📆 Annual Forecasts for Investors (Optional)
For long-term investors, on January 1st every year, we release our Annual Forecast per asset. Each includes:
- 12-month trend-top-bottom forecast graphs
- Master Projection Line for the entire year
- Projected Highs and Lows for the year
💵 Annual forecast requires a separate subscription:
$1500 per instrument
💡 Want Only One Forecast Graph?
If you’re only interested in the day-wise trend-top-bottom forecast of a specific stock, commodity, currency, index, yield, or VIX, you can subscribe to it individually for just $105:
👉 https://stock-commodity-forecasting.com/forecast-graphs/
🧠 How It Works: The Science Behind the Forecast
We do not rely on news, media noise, or analyst opinions. Our forecasts are based on a unique blend of mathematical sciences, including:
- Geometry
- Time Cycles
- Celestial analytics
This approach allows us to map the future in a way most people cannot see — until it’s already unfolded.
🎯 Final Word
You’re not here for long reports or speculation. You’re here to make money — and that requires clarity, structure, and conviction.
We deliver:
- ✅ Exact Entry
- ✅ Defined Stop
- ✅ Clear Trend
- ✅ Projected Target
If you’re ready to stop guessing and start forecasting, subscribe now:
👉 https://stock-commodity-forecasting.com/subscription-plans/
![]() Useful links
Useful links
Gold Year 2030 Forecast
In this Free Research section, I am sharing the Gold 2030 day-wise trend, top and bottom forecast graph as part of my ongoing Price-Time Research. This graph shows the time side of the research. It

A Year-End Message to All Followers
On this 31st March 2026, the last day of the financial year, I want to share one important message with all followers of Price Time Research. After more than two decades in the markets, and
🎯 PREDICTION CONFIRMED: Gold & Silver Hit New All-Time Highs
On December 18th, we released free research on this website predicting the start of a new bull rally in precious metals. Today, the markets have validated that call: Both Gold and Silver are trading at
Important Top Is Coming Up in Indian and U.S. equity
An important top is coming up in Indian and U.S. equity markets. (For insights into the exact price levels and precise timing where we expect this top to form, please refer to our Subscribers’ Page.)
