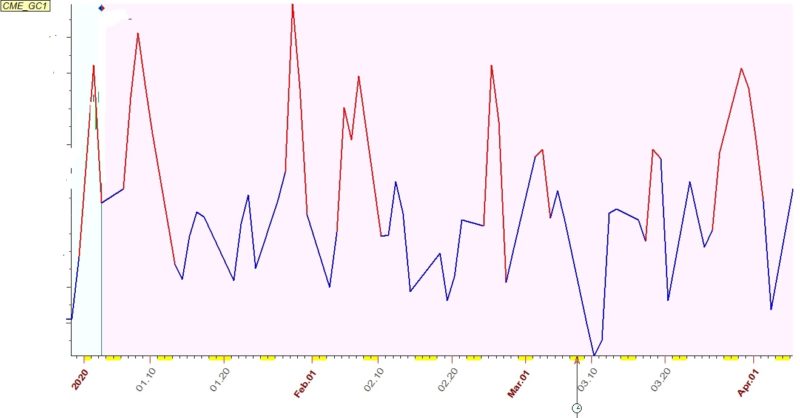
Please find above ☝️how gold is expected to trend in next 3 months.
In above chart you can see red-blue projection line of gold
Red indicate TOP(High)
Blue indicate Bottom(Low)
If you see the chart carefully you will see “Red” part is ending soon and gold will start declining from next week
This chart need to be used for “TREND” forecast only (not for price ).
This is part of our annual forecast of Gold year 2020 . I’m glad to share with you all
For entry,target,stops and daywise trend forecast I suggest you to see either our daily updates or annual forecast of gold e-book year 2020
Hope you find our research useful. Please read the disclaimer carefully
Best wishes


