Today is the last day of July,2023 ,
tomorrow we will enter into a brand new month ,August ,2023 .
I still remember 8 years ago, it was sunny morning, I was in Singapore with one of my client & around 11am ,18th august I sent an update to my subscribers that I am expecting large decline in global equity market and advised to short equity aggressively & ideal level to short s&p future given was 2138 (this level of 2138 was very important , this level was first given in march, 2009 as well as in year 2011 and in beginning of year 2015 & throughout 1st half of 2015 )
s&p future was trading @2104 on 18th august and by 24th august it was almost 13% down trading as low as @1831 (this was one of the best trade of the seasons ) we all made excellent money in this trade
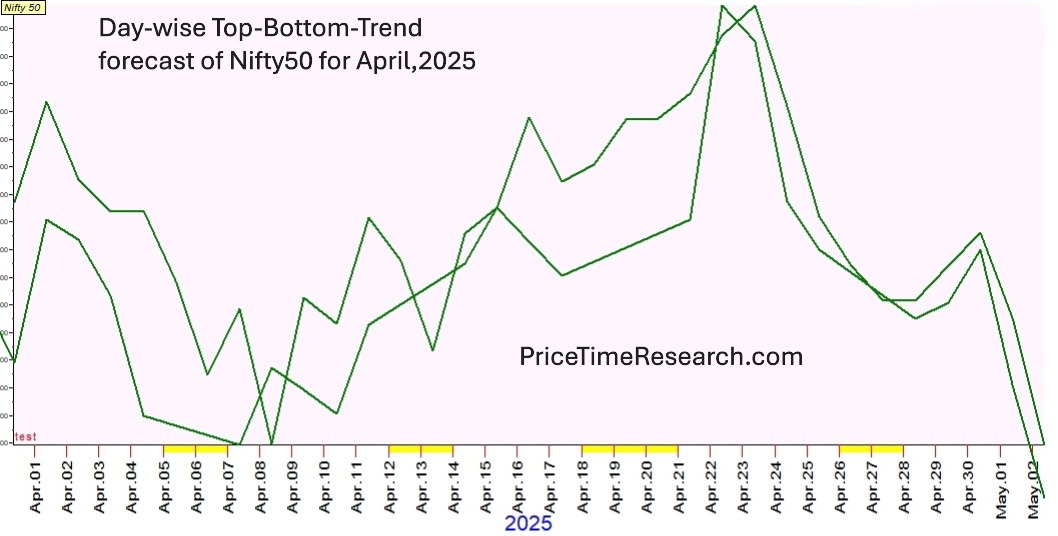
if you are willing to know how USA Equity is expected to unfold in august 2023 pls see our monthly trend-top-bottom forecast graph of s&p, nasdaq, dow, wilshire 5000 & vix sent to all our subscribers yesterday ,
in case you are not a subscriber , you can subscribe these 5 graphs at @$255 wherein you will receive day-wise trend-top-bottom forecast of all 5 assets for entire august in advance,
accuracy is not 100% but when you combine it with price forecast & see all graphs in combination to identify time window where all relevant graphs are indicating similar trend ,top, bottom in same time window , it is as good as 100%
(price forecast & trading strategies are part of our monthly, quarterly & annual popular subscription plan )
Hope you find our research useful
best wishes


