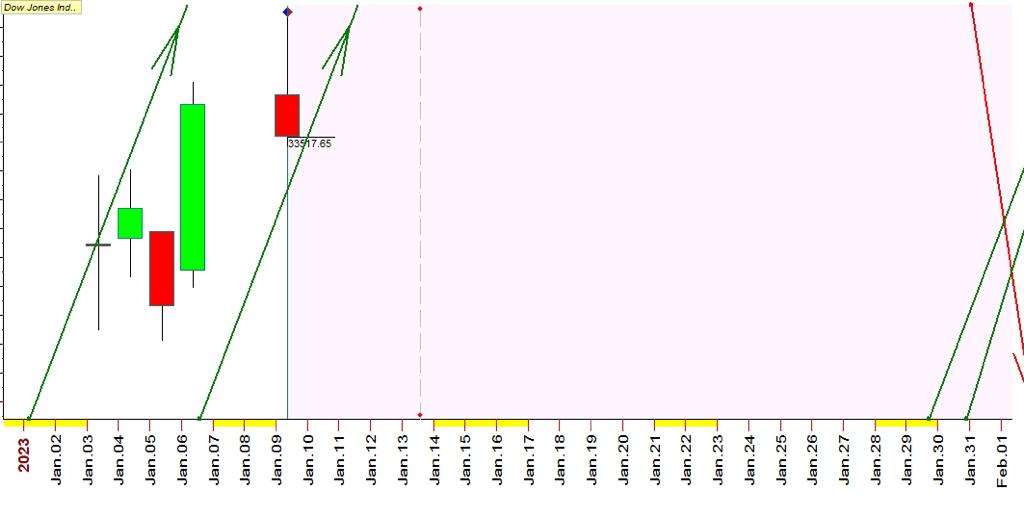
Please find attached Dow Jones “daywise trend forecast graph” for January,2023 ,
By looking at these graphs, we can know in advance the exact future dates where a certain asset is expected to go up or go down .
Green arrows indicate uptrend & Red arrows indicate downtrend ,
as we can see in the graph 2 green arrows are there on 30th January ,so it is indicating Dow jones will go up on monday,30th Jan,
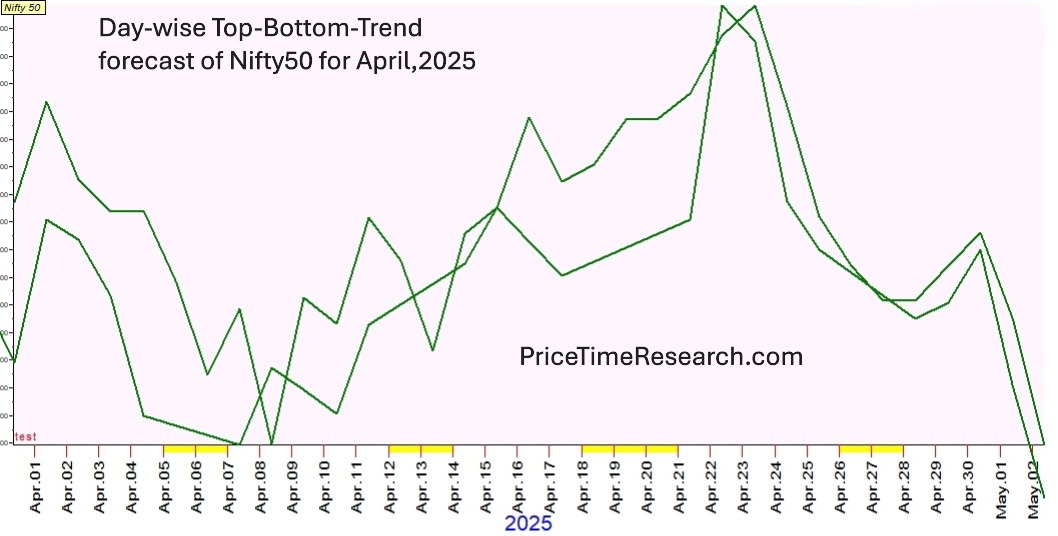
Along with arrow graph we will see “Anup Price Indicator” to know the ideal entry price to buy Dow jones , we will also check “trend top bottom forecast graph” of Dow jones for double confirmation & ideal entry date (“Trend Top Bottom forecast graph” help us to identify expected date of top & bottom )
Hope you find our research useful
Best wishes


