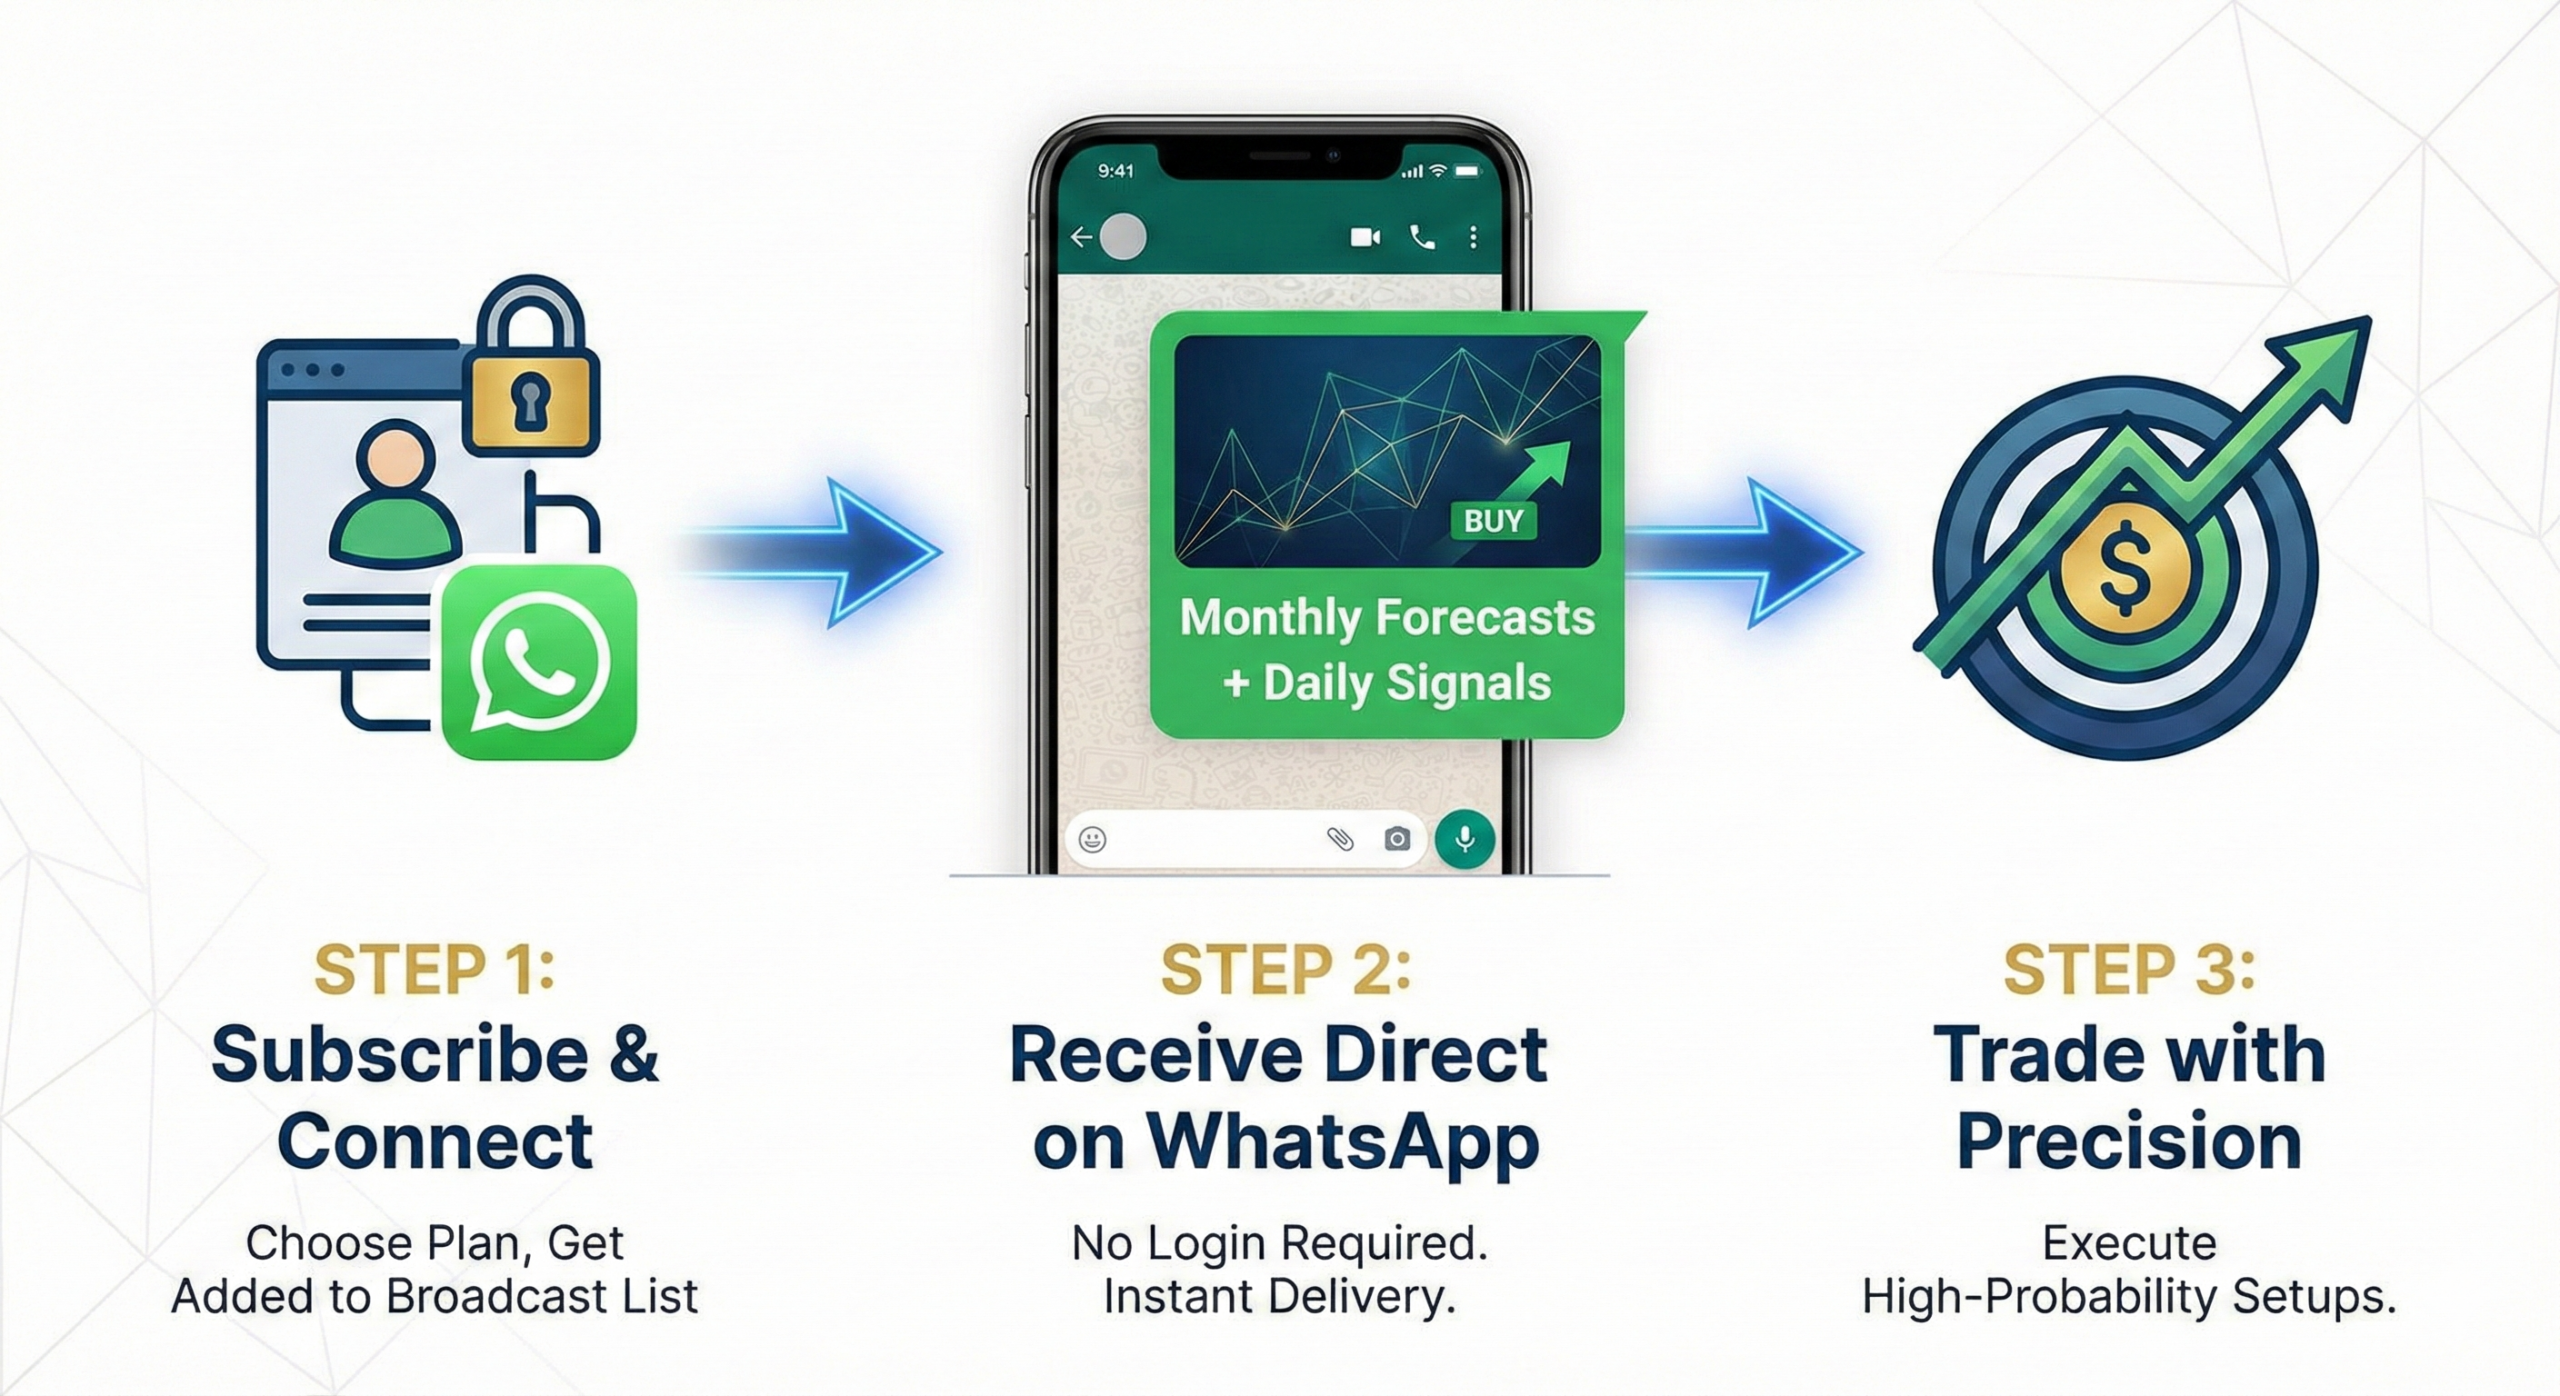
1. After you subscribe (https://stock-commodity-forecasting.com/subscription-plans/), your mobile number is added to the subscriber’s broadcast list in WhatsApp. All forecast graphs and updates are sent through WhatsApp, so that we can refer to what we have predicted in the past and how the market is unfolding (no emails, no weekly or monthly newsletter). (All subscriptions are full and final; there is no money-back policy.)
2. In forecast graphs and updates, what exactly do we provide?
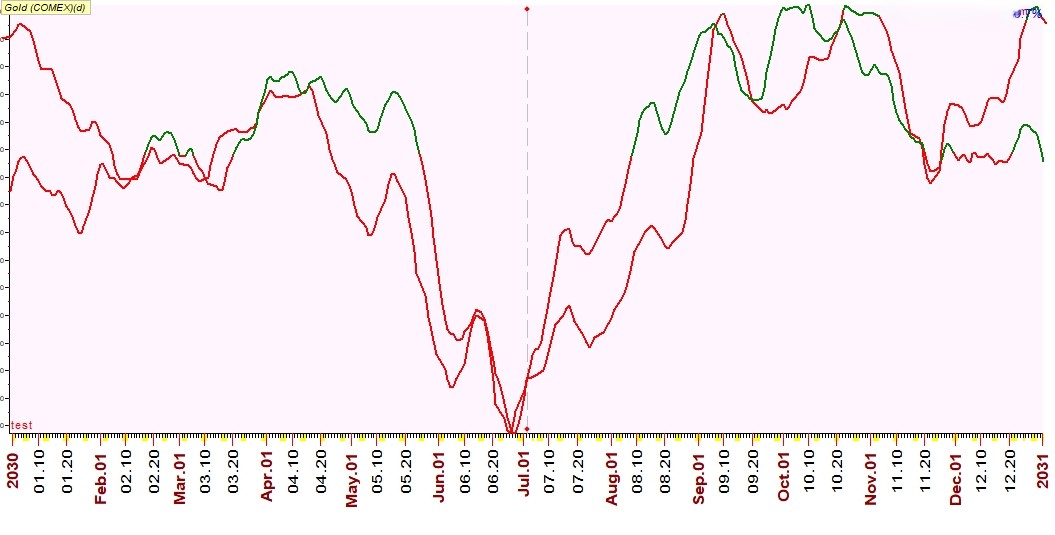
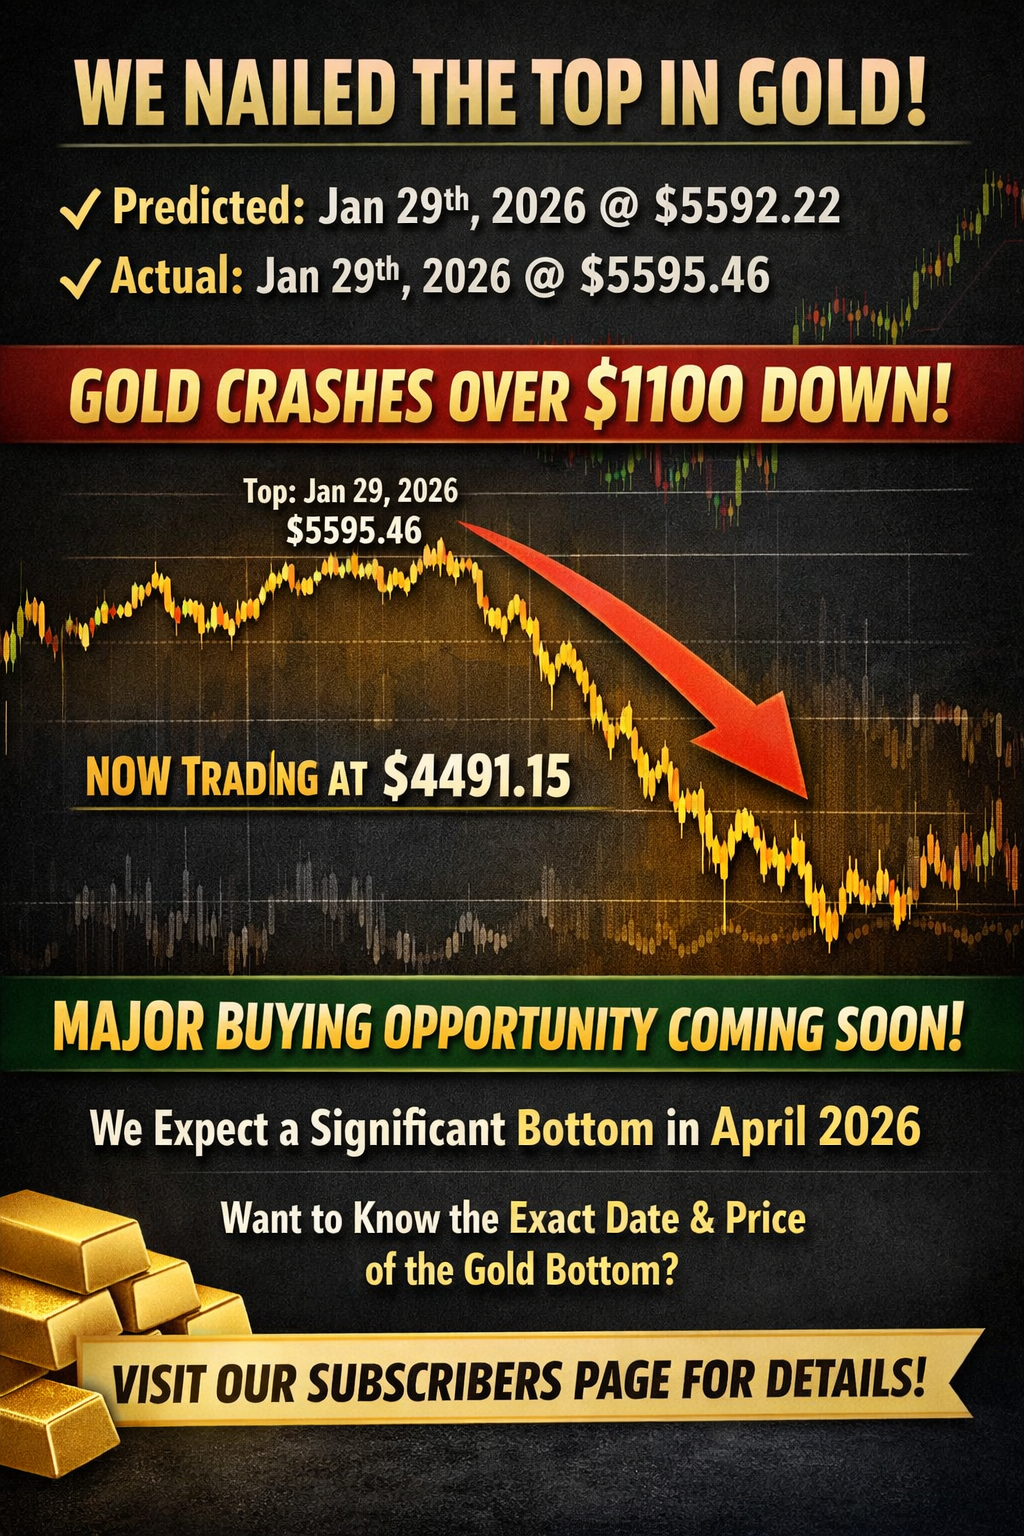
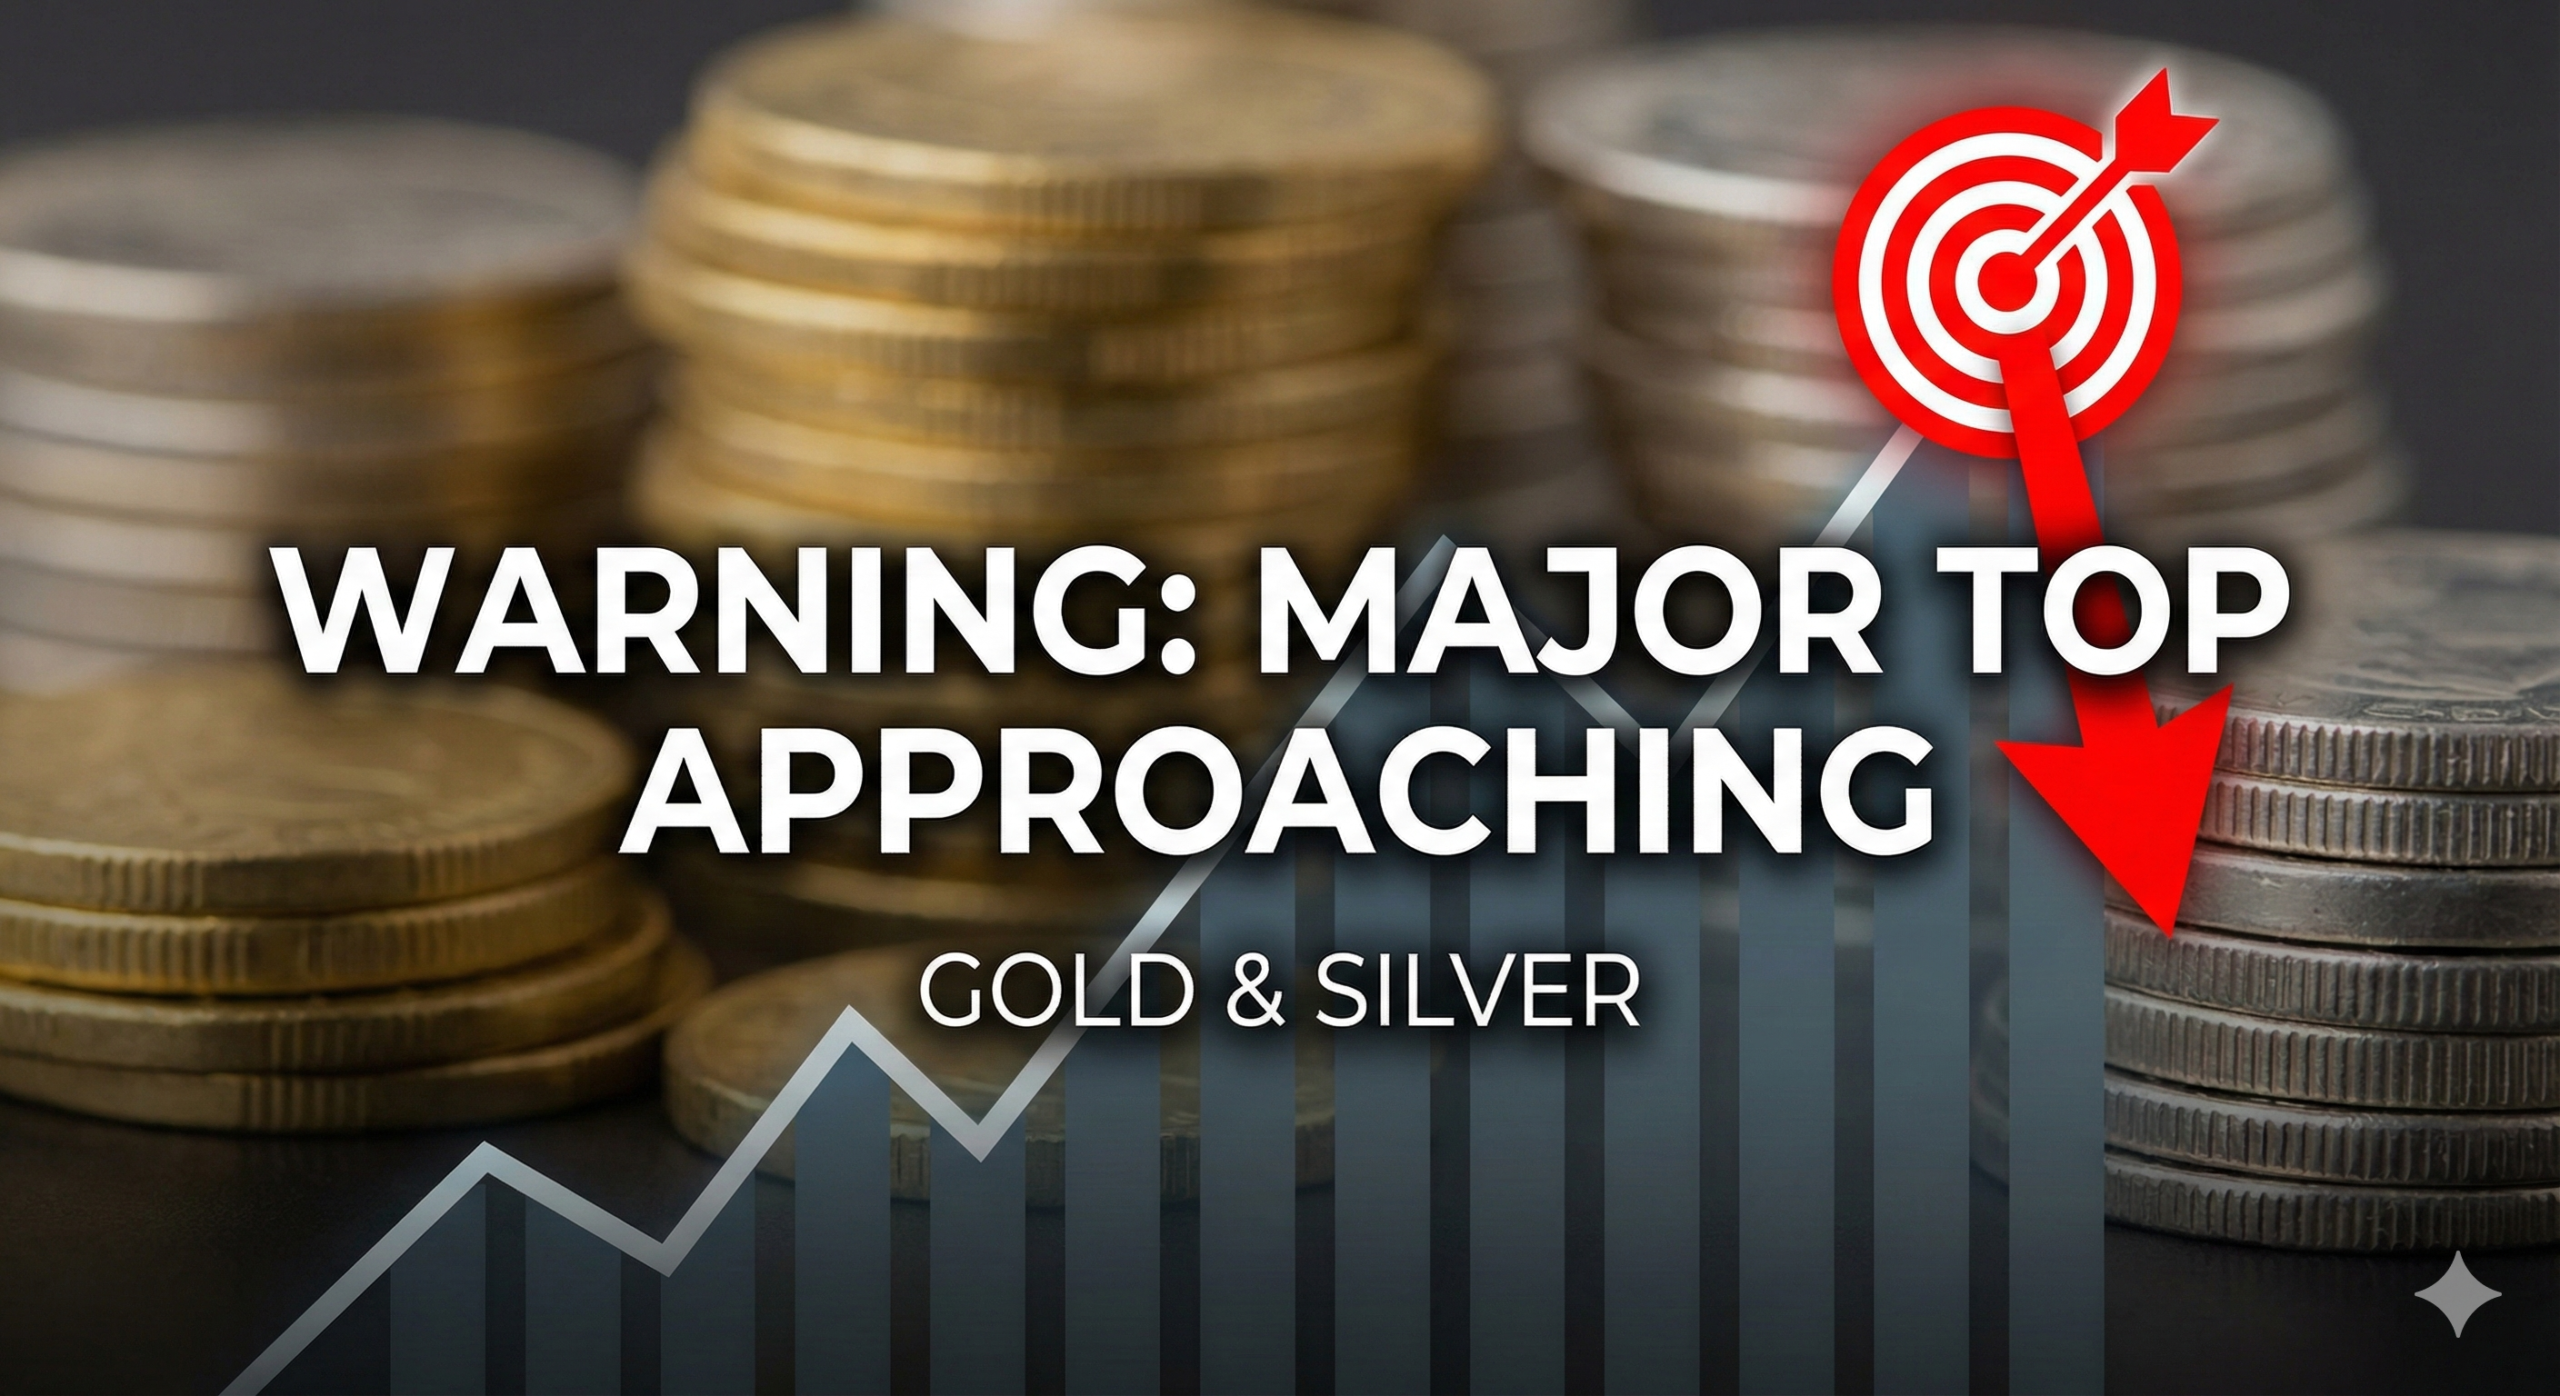
on 1st day of every month we send trend-top-bottom forecast graph (day wise) of entire month in advance of 32 major global assets including USA stock indices (s&p, Nasdaq, Dow Jones, Wilshire 5000) , Indian stock indices (Nifty50,Bank Nifty & Nifty500), Japanese stock indices (Nikkei) ,all major commodities including precious metals (Gold & Silver),Base Metal (Copper) Energy (Crude Oil & Natural Gas) , Soft commodities (Coffee & Cotton) , Grains (Soybean, Corn & Sugar) , all major currencies (US dollar index, EUROUSD,GBPUSD,USDJPY,USDINR) ,VIX (s&p & India ) ,yield (US 10yr Bond Yield & India Bond Yield) ,Crypto (Bitcoin), 3 major stocks (Amazon, Tesla & HDFC Bank) ( all forecast graphs are full & final we never change the forecast) By looking at these graphs, you can know in advance how markets are expected to unfold in the coming month (accuracy is not 100%, but it is as good as 100% when time and price come together).
3. After sharing these forecast graphs on the first day of the month, from the 1st to the 31st, we share price forecasts and trading opportunities based on the above forecast graphs where we see opportunities.
4. For investors, on January 1st, we provide an annual forecast for the upcoming year for the chosen asset, wherein we provide trend top-bottom forecast graphs for 12 months, a master projection line for the whole year, and & yearly projected high and low (need to be subscribed separately; subscription fee is $1500 for each financial instrument).
5. If you are only interested in day-wise monthly trend-top-bottom forecast graphs of any particular stock, commodity, currency, yield, vix, or indices, you can subscribe to them by paying just $105 using this link: https://stock-commodity-forecasting.com/forecast-graphs/.
6. These trend-top-bottom forecast graphs and price forecasts (projected highs and lows) are based on different branches of mathematics like geometry, cycles, and astronomy.
7. We never claim that we are 100% right because we understand that, except for God, nobody can be 100% right, but after being in the market for more than 2 decades, we can proudly say that we are more right than wrong (most importantly, we do not write stories; you are here to make money, and to make money, you need the exact entry, target, stop, and trend, which is exactly what we try to provide).
Wishing you a happy and profitable trading
best wishes